|
Report Features |
Details |
|
Product Name |
Copper |
|
Region/Countries Covered |
|
|
Currency |
US$ (Data can also be provided in local currency) |
|
Supplier Database Availability |
Yes |
|
Customization Scope |
The report can be customized as per the requirements of the customer |
|
Post-Sale Analyst Support |
360-degree analyst support after report delivery |
Request for Real Time Copper Prices: https://www.procurementresource.com/resource-center/copper-price-trends/pricerequest
Copper is a soft, ductile, and extremely malleable element. It is used in a variety of things, mostly as a heat and electricity conductor, and has an atomic number of 29.
It has an atomic mass of 63.546 u and a melting point of 1,085 °C. It appears brownish-red in colour. Cu is used to represent copper.
It is from Group 11 (Ib) of the periodic table. The electronic configuration of copper is [Ar] 3d¹⁰4s¹ and its density is 8.96 g/cm³.
The top copper producing countries include Mexico, Chile, Peru, Australia, Canada, and Chile.
Key Details About the Copper Price Trend:
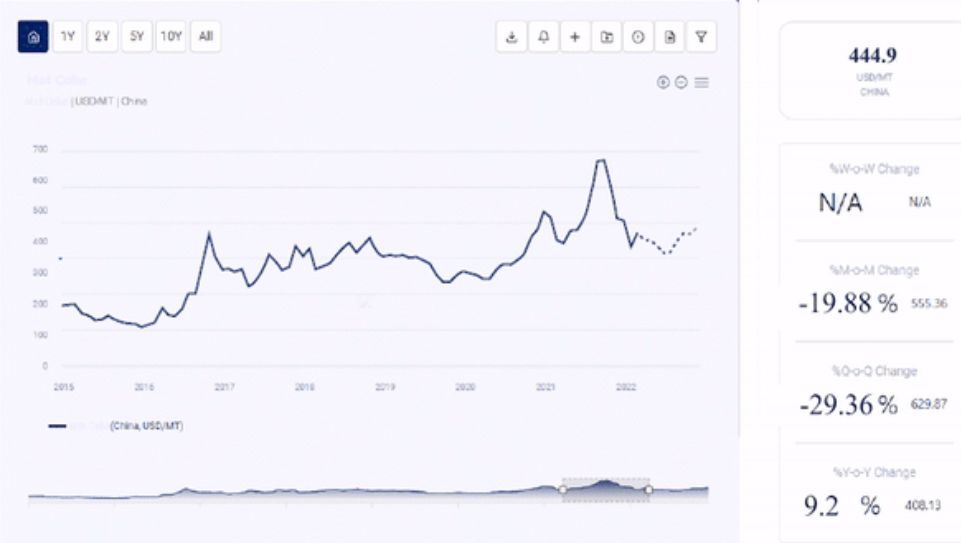
Procurement Resource does an in-depth analysis of the price trend to bring forth the monthly, quarterly, half-yearly, and yearly information on the Copper price in its latest pricing dashboard. The detailed assessment deeply explores the facts about the product, price change over the weeks, months, and years, key players, industrial uses, and drivers propelling the market and price trends.
Each price record is linked to an easy-to-use graphing device dated back to 2014, which offers a series of functionalities; customization of price currencies and units and downloading of price information as excel files that can be used offline.
The Copper price chart, pricing database, and analysis can prove valuable for procurement managers, directors, and decision-makers to build up their strongly backed-up strategic insights to attain progress and profitability in the business.
Industrial Uses Impacting Copper Price Trend:

Copper can be used to convey signals to tiny bodily implants or diagnostic devices when it is properly enclosed. Because copper is easy to pull into wire and is highly conductive, it is now conceivable to include minuscule copper wires within these devices.
Copper has been used in aircraft for a long time. Busbars, bonding wire, and lock wire all contain copper in an aircraft’s electrical system.
Printed circuit boards, copper conductors, and external cables are all used in the electronics sector. In computer chips produced by IBM and Motorola, copper has replaced aluminum. Manufacturers have found copper to result in quicker operating speeds and improved circuit integration.
Key Market Players:
- Umicore N.V
- American Elements
- MMC Norilsk Nickel PJSC
- Korea Zinc Co., Ltd.
- Jinchuan Group International Resources Co. Ltd
- Glencore plc
- The Doe Run Resources Corporation
- Codelco Mining company
- Freeport-McMoRan Inc.
- Broken Hill Proprietary (BHP)Group Limited
- Rio Tinto plc
News and Events:
- September 19, 2022: Since the start of the year, copper prices have been erratic, averaging USD 3.50 per pound (USD 7,700) at the end of the two months, down 21% from their peak levels in early March.
About Us:
Procurement Resource offers in-depth research on product pricing and market insights for more than 500 chemicals, commodities, and utilities updated daily, weekly, monthly, and annually. It is a cost-effective, one-stop solution for all your market research requirements, irrespective of which part of the value chain you represent.
We have a team of highly experienced analysts who perform comprehensive research to deliver our clients the newest and most up-to-date market reports, cost models, price analysis, benchmarking, and category insights, which help in streamlining the procurement process for our clientele. Our team track the prices and production costs of a wide variety of goods and commodities, hence, providing you with the latest and consistent data.
To get real-time facts and insights to help our customers, we work with a varied range of procurement teams across industries. At Procurement Resource, we support our clients, with up-to-date and pioneering practices in the industry, to understand procurement methods, supply chain, and industry trends, so that they can build strategies to achieve maximum growth.
Media Contact
Company Name: IMARC Group
Contact Person: Elena Anderson
Email: Send Email
Phone: +1-631-791-1145
Address:30 N Gould St Ste R
City: Sheridan
State: WY
Country: United States
Website: https://www.imarcgroup.com
